Property Damage Only (PDO) collisions refer to any collision in which none of the involved parties were injured. In California there is a great deal of variability how PDO collisions are collected and reported by local police departments. Unlike injury involved collisions, it is not required to report PDO collisions to the Statewide Integrated Traffic Records System (SWITRS). Therefore individual police departments set their own standards on how to collect, manage and report PDO collisions.
Due to this variability, most research and analyses typically exclude PDO collisions. It would not make sense to conduct a statewide study of all collisions when some jurisdictions do not report any PDO collisions. When I worked at UC Berkeley it was quickly established that we did not use PDO data, so I never did. However, many planners and traffic engineers find value in having PDO collision data for local analyses since it could possibly allow them to identify trends before injury collisions occur. This may even be in conflict with their local police department that feels they do not have the resources to collect and report PDO collisions even if they were able to in the past.
The end result is a lot of uncertainty and when clients or others ask me about PDO collisions, I simply rehash the text above and that is the end of it. In order to give a better answer next time I decided to do an exploratory analysis of PDO collisions in this blog. I may also consider developing a research paper with a more formal analysis if this exploration is meaningful.
The main questions I wanted to explore:
- How consistently are PDO collisions reported to SWITRS?
- Has that consistency changed over time?
- What are the urban/rural differences?
- Are there any other trends that can be easily identified?
For this blog post I used statewide data from 2004 to 2013 and aggregated collisions by county for a high level overview. In a subsequent blog post I plan to break down the numbers by city/jurisdiction for a more in-depth analysis.
As a first step I calculated the percentage of PDO collisions out of all collisions over the entire period for each county. This made more sense than using the collision counts since the number of collisions can fluctuate greatly from year to year due to changes in traffic volume. The percentage PDO should also help identify outliers that may appear if there was a major change in PDO reporting methods during those years. Finally, to review urban/rural trends, I used the population designation for each county as noted in this CHEAC report. In the following figures and tables the rural counties are shown in red and urban counties are blue.
Figure 1
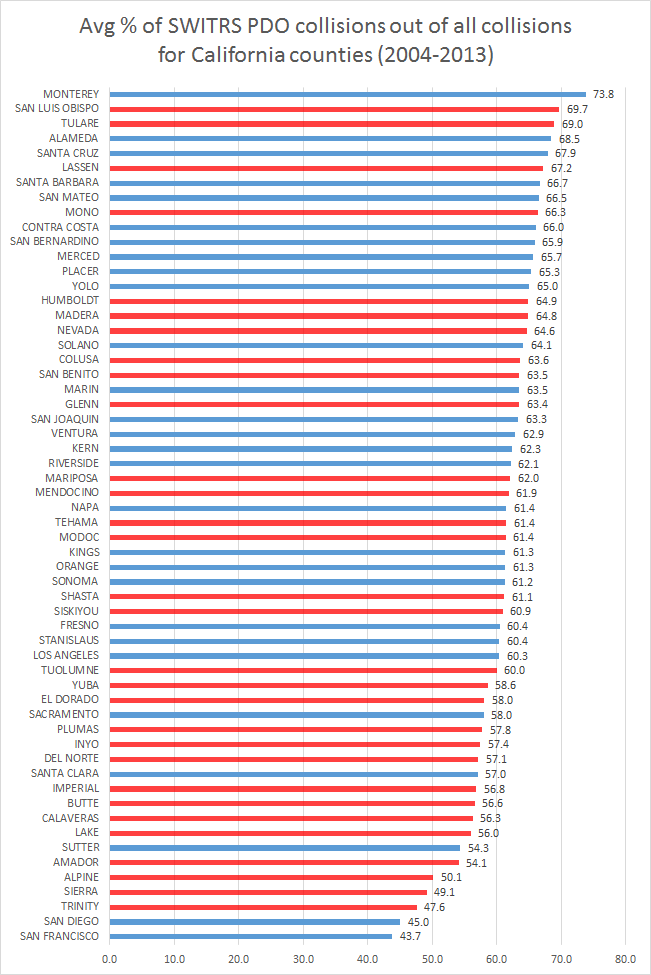
The highest percentage of PDO collisions was in Monterey County (73.8%). At the bottom San Francisco and San Diego counties come in just below three of the most rural counties in the State: Alpine, Trinity and Sierra. Overall, however, the urban counties generally have higher percentages of PDO collisions while the rural counties have lower percentages. This is the expected result if PDO collisions are consistently reported. Collisions in urban areas are more likely to be PDO or minor injury collisions since speeds are generally lower than in rural areas. On the other hand, rural counties will experience a far greater percentage of fatal or severe collisions. There is plenty of literature on this aspect of urban vs rural such as the 2012 Traffic Safety Facts. That is why it is somewhat surprising that Monterey county has such a high percentage due to the lack of a major metropolitan area and I will want to investigate further to see if there are some cities or jurisdictions that are just very vigilant about reporting PDO collisions. On the other hand, what does this mean for the San Francisco and San Diego counties? Well, this shows that they both likely contain major jurisdictions that are not reporting PDOs. If they consistently reported PDOs than San Francisco would likely flip from the lowest to one of the highest percentages considering the urban density in the County. Fortunately I can somewhat test that theory by summarizing the complaint of pain (COP) collisions, the lowest injury level that police departments are required to report to the State.
COP collisions should occur at a similar frequency to PDOs since it signifies only a slightly higher level of impact in the collision where the officer determined one or more of the occupants was complaining of pain but there were no visible injuries. Therefore the percentage of COP collisions out of all injury collisions (COP, other visible injury, severe injury, and fatality) would provide a good relative perspective to the percentage of PDOs if PDOs were required to report as well. Figure 2 shows the percentage of COP collisions out of all injury collisions for each county (all PDO collisions were excluded). It gives a drastically different picture from Figure 1 that confirms the inconsistencies of PDO reporting.
Figure 2
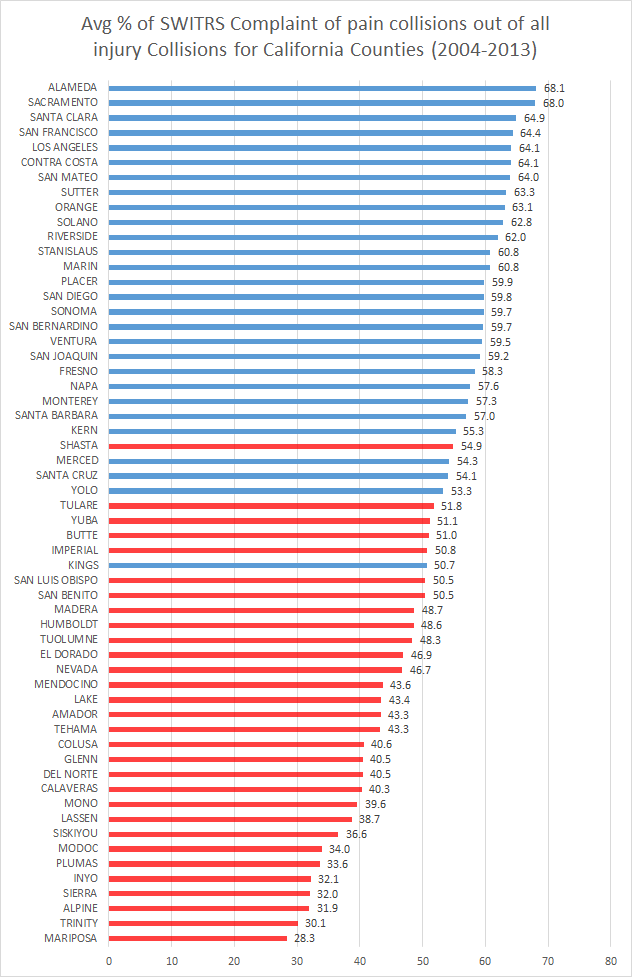
Figure 2 shows almost a complete separation of rural counties at the bottom and urban counties at the top. San Francisco has moved from the lowest percentage of PDOs to the 4th highest percentage (64.4%) of COP collisions. Monterey County dropped towards the middle of the pack with (57.3%) which would seem a more reasonable standing compared to its high percentage of PDO collisions. The four most rural counties in the State (Sierra, Alpine, Trinity, Mariposa) all now are found at the very bottom. Mariposa County is the lowest with 28.3% which is interesting since it was closer to the middle of the pack for PDO collisions. That may signify better PDO reporting in the County, but I will look into that more in the next blog post.
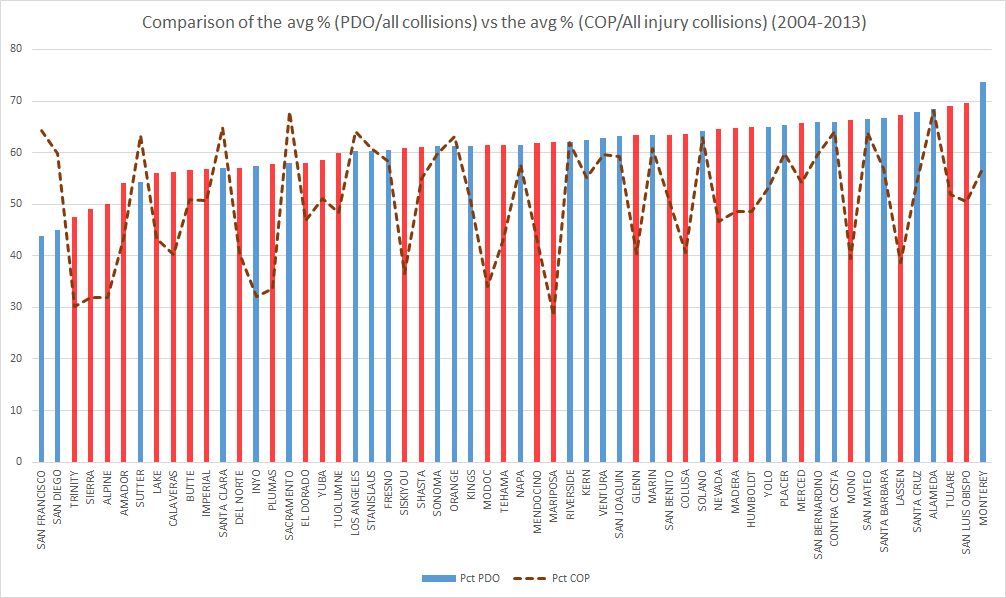
Figure 3 combines the first two figures so you can see them both on the same axis. Besides major differences in Monterey, San Francisco, San Diego and Mariposa counties it shows that all the rural counties have lower percentages of COP collisions than PDO collisions. This confirms that the rural counties exhibit a much larger percentage of higher injury collisions and this fact would be distorted if PDO collisions were used for any analysis.
Figure 3
I think just those few figures give a nice comparative insight into overall county level trends of PDO collisions and provides good direction for further investigation at the city level. For a final analysis at the county level I compiled the table showing the percentage of PDO collisions by year for each county in Table 1.
Table 1
I thought Table 1 might show major discrepancies in any given year regarding PDO reporting. However, for the most part the percentages in each county do not fluctuate greatly from year to year. Most counties stayed within a 5% to 10% range over the years and nothing stood out as an outlier. To get a better sense of any trends I decided to separate by urban and rural counties and calculate the percentage PDO collisions for each year. Figure 4 shows the results.
Figure 4
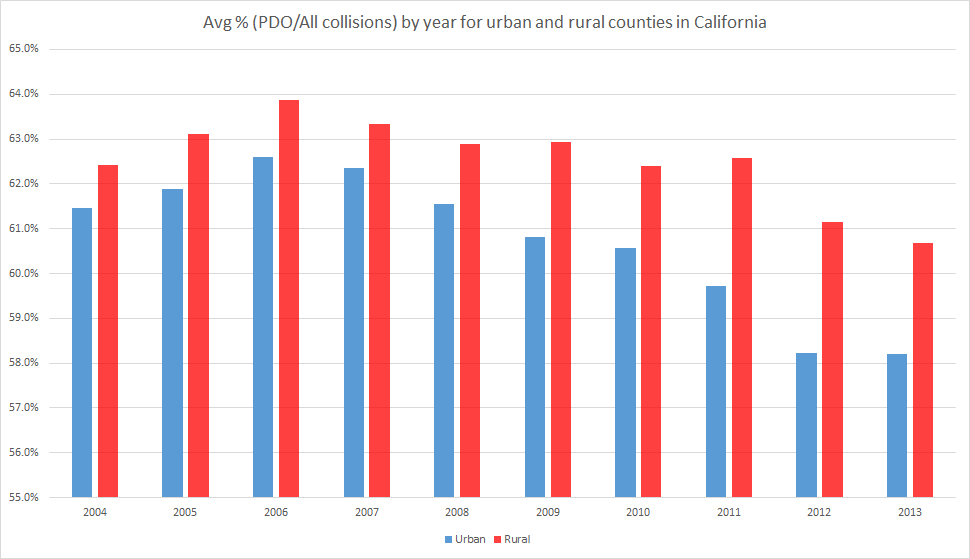
Now you can see that both urban and rural percentages trend downwards after peaking in 2006. Perhaps 2006 marked the final year that multiple agencies started policy changes to de-emphasize PDO reporting? This could especially be a factor in urban counties as their percentages fell more sharply than rural counties. Of course it is important to consider the small scale of the chart and the fact that it’s only a few percentage points, but nevertheless it is an interesting graphic to consider the trends.
There are still plenty of issues to explore, but this analysis shed at least a little light on the subject. We know that PDO collisions are not consistently reported and those discrepancies are clearly shown by the PDO percentages in San Francisco and San Diego counties. These findings also confirm the need to avoid including PDO collisions if you are doing any comparative analysis outside of a particular county (and possibly city as we investigate further). I hope to provide more useful results and possibly answer some of the newly raised questions in a future blog post.